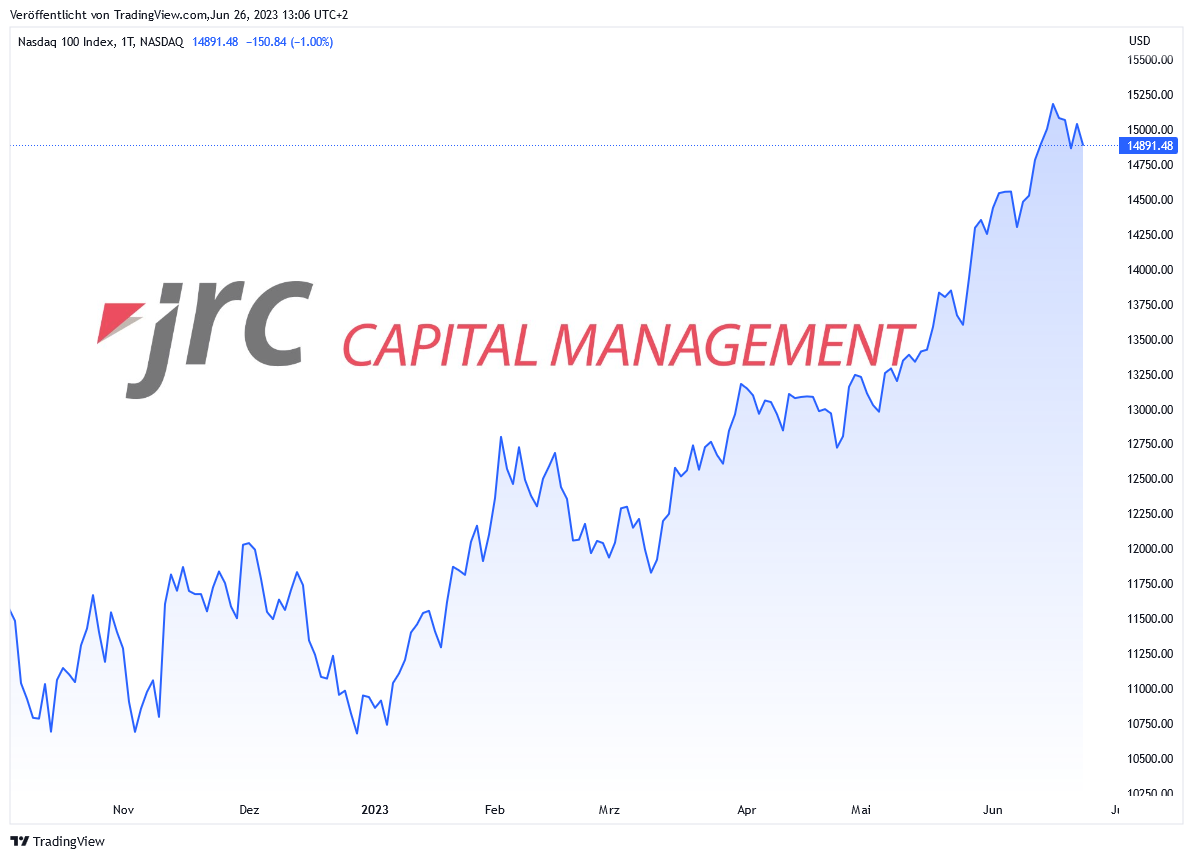
The Nasdaq 100 is currently at about 14890 points and yesterday recorded a 1% decline. Since mid-March, the index has been on an upward trend. The last low was reached on June 7 at around 14290 points, while the last high was on June 16 at around 15280 points.
The next resistance is at the last high of 15280 points. Should the index overcome this level, a strong upward movement towards 15300 points and then even to 15600 points could follow. This could indicate that the uptrend is still intact and the market remains bullish.
On the other hand, the last low at 14290 points provides important support. If the index cannot hold this mark, it could fall to 14525 points and then further to 14400 points. Such a decline could indicate that the market is experiencing a consolidation or possibly a trend reversal.
Overall, the technical chart analysis suggests that the Nasdaq 100 could undertake a strong upward movement towards the resistance levels at 15300 points and 15600 points in the near future. However, it is important to keep an eye on the support levels at 14290 points, 14525 points and 14400 points, as a breach of these levels could indicate a possible trend reversal. Investors should also closely monitor the releases of the U.S. Purchasing Managers Index for potential market impact.
https://de.tradingview.com/chart/?symbol=NASDAQ%3ANDX

