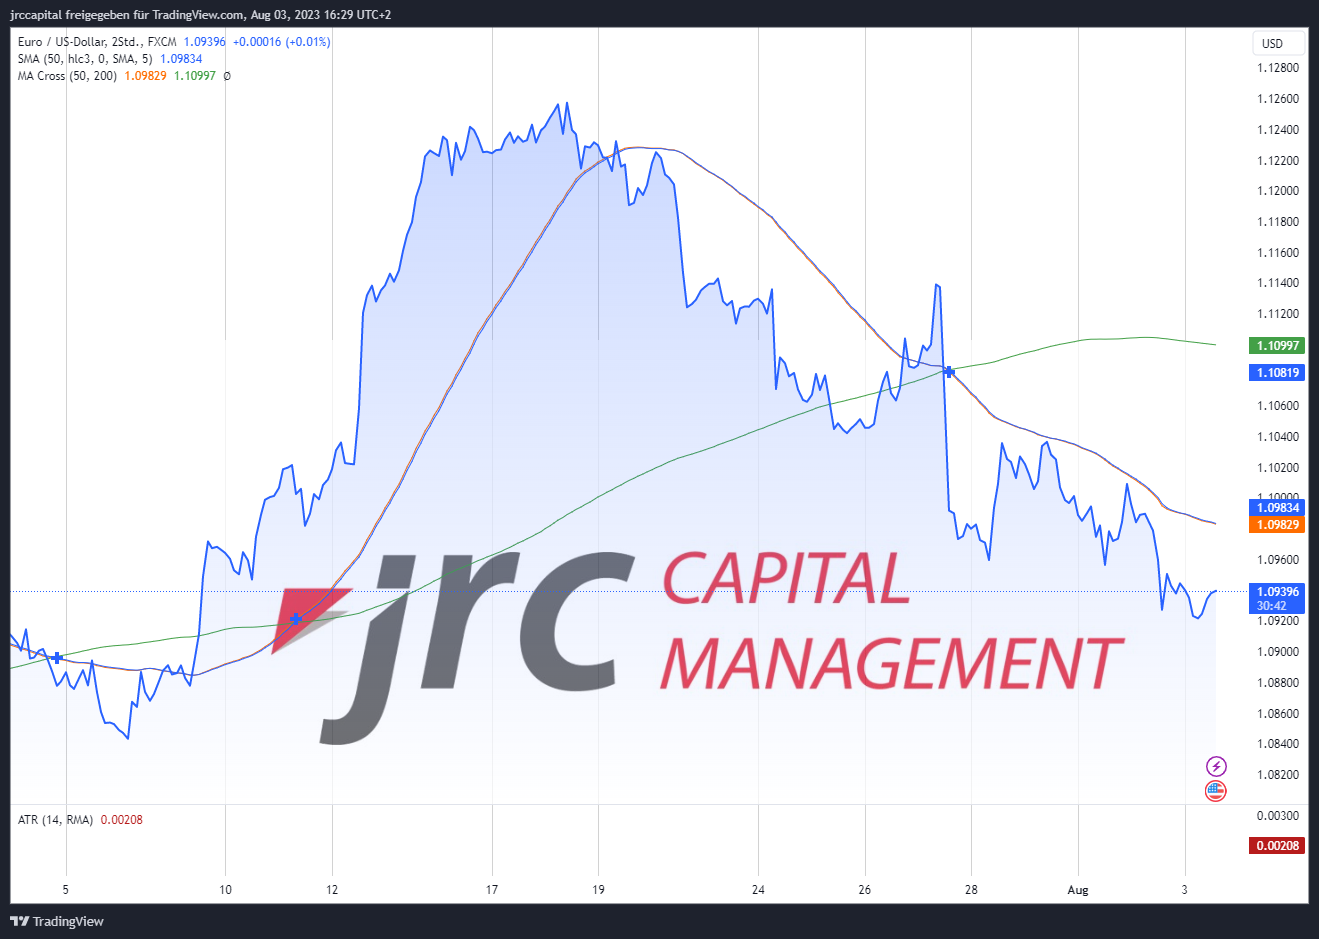
The EUR/USD is currently trading at $1.0922, down -0.1 percent today. The last low was reached at around US$1.0913 at around 9:00 this morning, while the last high was at around US$1.1276 on July 18. This shows that the currency pair has been in a downtrend since mid-July.
Now let’s look at the indicators in the 2-hour chart: The 50 moving average is at 1.0983, while the 200 moving average is found at 1.11. These two indicators can show important support and resistance levels and give us clues about the average price trend.
The next resistance is at $1.0957, while the next support is at $1.0912. The expectation for the coming movement is a further downward movement towards 1.09 US dollar. This could provide a potential entry point for a short position if the price continues to fall.
However, there is also the possibility of a rise above resistance at $1.0957, which could then lead towards $1.098. This could be interesting for those who are betting on a short-term upward movement.
In terms of current economic numbers and dates, note that auctions of new U.S. government bonds will take place late this afternoon, followed by the release of the FED’s balance sheet and reserve balance at 10:30 pm. These events could potentially have an impact on the price of the EUR/USD and should therefore be kept an eye on.
Conclusion: The EUR/USD is currently in a downward movement and is trading at 1.0922 US dollars. A possible short position could arise if the price falls further towards $1.09. Alternatively, a rise above resistance at $1.0957 could trigger a move towards $1.098. Traders should keep an eye on economic numbers and dates to make informed trading decisions.

