JRC FX core strategy.
Consultancy & Research GmbH
Asset management
JRC FX core strategy as the basis of our actions
As a company, we at JRC Capital have always combined the theory of finance with practice in the financial market. The direct findings from our daily work and our research flow into our JRC FX core strategy. This investment strategy is the foundation for many of our products and services in the field of asset management.
Start of innovative asset management in 2003
Our JRC FX core strategy was born in 2003. It has its origins in the years of experience of JRC Capital Management in the areas of active asset management and scientific research on trading models. Since then, our FX core strategy has been in use without interruption and forms the basis of a large number of our financial products with a minimum investment of five million euros.
To ensure that our asset management solutions continue to be as successful on the market, we are constantly developing the strategy and monitoring it continuously. Because we can only offer our customers high-performance products in the long term by taking into account new scientific findings and market developments.
The aim and functionality of our investment strategy
The goal of the FX Core investment strategy is absolute capital growth. This should be generated in the systematic trading of the most important currency pairs. We rely on the optimal use of upward and downward trends. These can be short-term, medium-term or long-term trend movements. In addition, it offers a risk-return profile, which is an interesting diversification from traditional forms of investment such as stocks and bonds.
Uniquely diversified investment strategy
Security, high capital growth and stable usable trading systems are what drives us. We use different analysis methods for this. For the FX core strategy, this leads to a stable foundation from which it can fully develop its advantages for our solutions and models.
Consideration of diverse trend following and trend change approaches
An important feature of the FX core strategy from JRC Capital is the combination of various trend following and trend changing approaches. The spectrum that the investment strategy takes into account is very broad and includes, among other things:

- Trend following
- Countertrend
- Pattern systems
- Momentum
- Swing
Use of highly liquid currency pairs
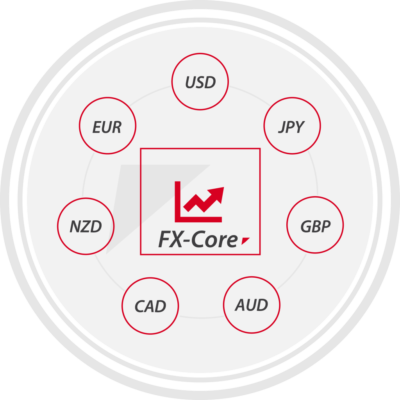
Thanks to our experience in financial research and practical experience, the FX core strategy is limited to highly liquid currency pairs. The following figure shows you a selection of currencies that are traded as currency pairs in the FX core strategy.
Integration of different time horizons
The FX-Core investment strategy uses different time horizons and is thus ideally adjusted to the dynamic, constantly changing and sometimes chaotic market conditions. The time horizons that we take into account are:
- short term (a few minutes to hours)
- medium term (a few hours to 2 days)
- long-term (days to weeks)
Continuous adjustment of the investment strategy for sustainable success
Since its implementation in 2003, the investment universe of the JRC FX core strategy has been continuously expanded and optimized. The integrated trading systems are checked regularly. For example, the stability of the individual models and important performance indicators are considered. In addition, the current market environment in which the system operates is analyzed.
New trade ideas that arise from the synergy effects of the cooperation between the trade and research departments go through many test steps before they can be integrated, which conclude with live tracking.
The composition of the core strategy is based on a balanced combination and allocation of these carefully tested trading algorithms, taking into account their specific risk characteristics, so that they form an optimally diversified portfolio.
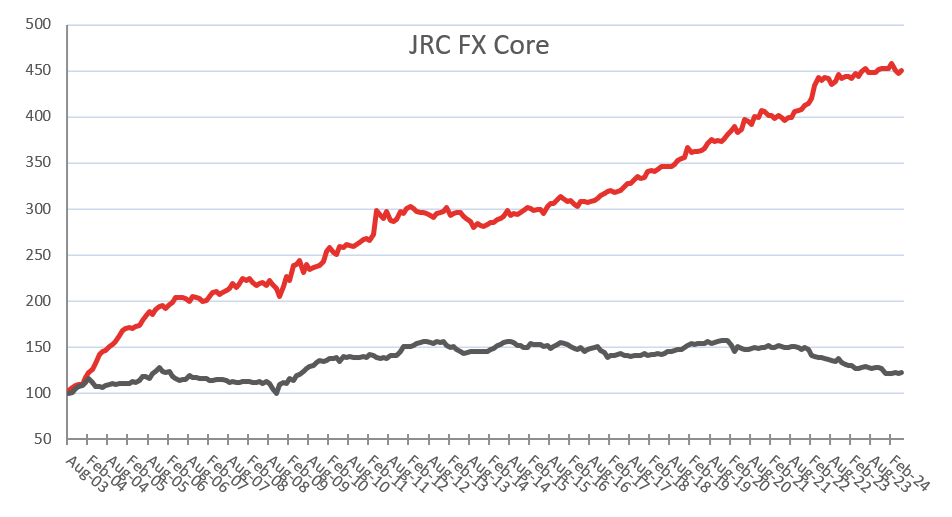
—JRC Fx Core Strategie
—DB FX Volatility Premium EUR Index (volatility adjusted)
| Jan. | Feb | March | Apr | May | Jun. | Jul. | Aug | Sept | Oct | Nov | Dec | Jahr* | |
| 2024 | 0,12 | 1,26 | -1,72 | -0,65 | 0,64 | -0,37 | |||||||
| 2023 | -0,05 | -0,32 | 1,25 | -0,71 | 1,12 | 0,68 | -0,81 | -0,02 | -0,17 | 0,78 | 0,38 | -0,18 | 1,94 |
| 2022 | 0,57 | 1,18 | 3,45 | 1,89 | -0,64 | 0,8 | -0,34 | -1,35 | 0,6 | 1,87 | -1,07 | 0,48 | 7,58 |
| 2021 | -0,97 | -0,13 | -0,75 | 0,96 | -0,77 | -0,73 | 0,93 | -0,1 | 1,6 | 0,27 | 0,4 | 0,96 | 1,65 |
| 2020 | 0,93 | 1,18 | 1,15 | -1,65 | 0,99 | 2,6 | -0,49 | -0,82 | 2,28 | -0,21 | 1,84 | -0,33 | 7,63 |
| 2019 | 3,22 | -1,56 | 0,4 | -0,02 | 0,12 | 0,8 | 1,25 | 1,22 | -0,49 | 0,15 | -0,32 | 1,11 | 5,96 |
| 2018 | 1,66 | 0,41 | -0,16 | 0,46 | 0,95 | -0,07 | 0,21 | 0,08 | 0,56 | 1,07 | 0,58 | 0,38 | 6,31 |
| 2017 | 0,51 | 0,47 | -0,78 | 0,48 | 0,34 | 1,19 | 0,94 | 0,07 | 1,54 | 0,95 | -0,73 | 0,42 | 5,52 |
| 2016 | -0,45 | 0,11 | -1,21 | -0,9 | 1,89 | 0,11 | -0,68 | 0,51 | 0,33 | 0,61 | 1,31 | 0,65 | 2,27 |
| 2015 | 1,19 | -0,18 | -0,73 | 0,08 | 0,23 | -1,33 | 2,57 | 0,92 | -0,03 | 1,4 | 0,96 | -0,99 | 4,09 |
| 2014 | 1,03 | 0,88 | -0,14 | 1,14 | 0,24 | 0,82 | 2,08 | -1,64 | 0,78 | -0,35 | 0,67 | 0,57 | 6,2 |
| 2013 | 1,53 | -2,86 | 0,61 | 0,25 | 0,01 | -1,34 | -1,15 | -0,64 | -2,2 | 1,46 | -0,9 | -0,49 | -5,69 |
| 2012 | 2,15 | 0,61 | -0,71 | -1,12 | -0,24 | -0,2 | -0,27 | -0,74 | -0,53 | 1,33 | 0,23 | 0,54 | 0,96 |
| 2011 | 0,56 | -1,03 | 2,63 | 9,33 | -1,79 | -0,98 | 2,67 | -3,44 | -0,31 | 0,61 | 3,04 | -0,78 | 10,36 |
| 2010 | 4,8 | 1,42 | -2,07 | -0,88 | 3,83 | -0,66 | 1,39 | -0,63 | -0,34 | 1,12 | 0,81 | 1,09 | 10,08 |
| 2009 | 4,93 | -1,83 | 7,47 | 0,59 | 1,47 | -5,02 | 3,55 | -2,24 | 1,04 | 0,5 | 0,12 | 1,82 | 12,42 |
| 2008 | -1,33 | 1,17 | -1,97 | -1,62 | 1,1 | 0,57 | -1,65 | 2,59 | -1,76 | -2,04 | -4,02 | 5,21 | -4,06 |
| 2007 | 0,81 | 2,02 | 1,97 | 0,35 | -1,18 | 1,11 | 0,69 | 1,03 | 2,83 | -1,92 | 1,88 | 2,56 | 12,69 |
| 2006 | -1,53 | 2,05 | 1,41 | 2,81 | -0,22 | 0,19 | -0,63 | -1,66 | 2,64 | -0,21 | -0,6 | -1,75 | 2,33 |
| 2005 | 1,49 | 0,61 | -0,55 | 1,52 | 0,63 | 3,11 | 2,07 | 3,03 | -1,46 | 2,71 | 1,9 | 0,32 | 16,34 |
| 2004 | 7,68 | 4,37 | 2,83 | 5,19 | 7,15 | 2,06 | 0,74 | 3,08 | 1,68 | 2,37 | 3,7 | 3,27 | 53,84 |
| 2003 | 3,46 | 2,5 | 2,07 | 0,98 | -0,35 | 8,91 |
*Year-to-date (YTD)
Source: JRC FX Core Track Record (net performance including 1.5% management fee and 20% performance fee), the specific costs of a product based on the JRC Core strategy may differ from this and are based on the product requirements agreed with the customer dependent.
The underlying investments of this strategy do not take into account the EU criteria for environmentally sustainable economic activities.
Legal notice
Please note the legal information from JRC Capital, which you can click on link can retrieve.
Abstract:
(…) The document is for informational purposes only and for use by the recipient. It constitutes neither an offer nor an invitation by or on behalf of the JRC to buy or sell any securities. Only the published product-related base prospectus and any published supplements as well as the published final conditions are legally relevant. A reference to past performance is not to be understood as an indication of the future. (…)
Status: July 2016
JRC Capital Management
Asset management in Berlin:
Get free advice now!
You can rely on JRC Capital Management Consultancy & Research GmbH, your asset manager in Berlin, in every market phase. Arrange your free and non-binding initial consultation now. Find out more about your options with our asset management in Berlin!

