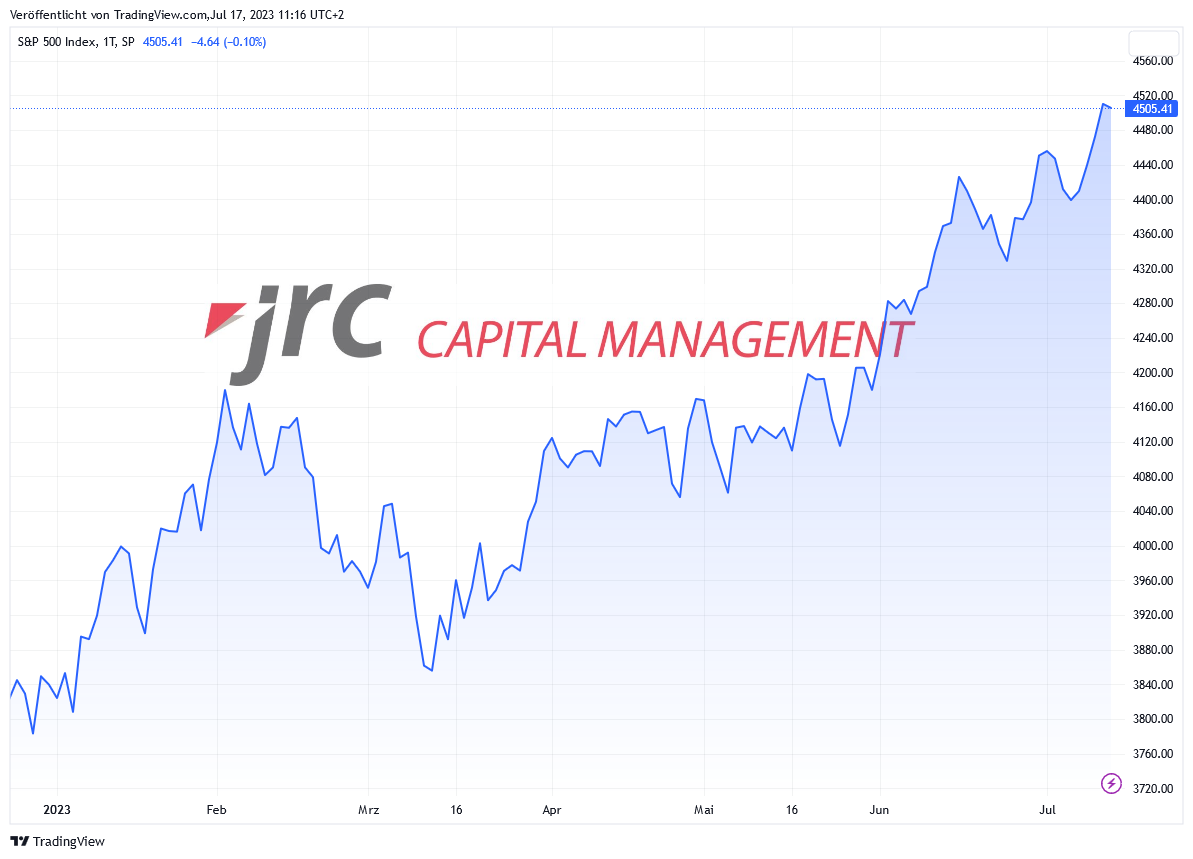
The S&P 500 Index currently stands at around 4505 points and recorded a price increase of around 2.4% last week. The last low was marked on May 26 at around 4330 points, while the last high was reached on Friday at around 4527 points. Already since mid-March, the index has been in an impressive upward movement with a total increase of 18%.
Now let’s take a look at the indicators. The 50-day moving average is at 4277 points, while the 200-day moving average is at 4026 points. These values illustrate that the index has shown a positive development over a longer period of time.
In terms of resistance and support levels, it shows that the next resistance is at 4537 points, while the next support is found at 4498 points. An upward movement towards 4600 points is expected, based on the continued upward momentum.
There could be a potential entry opportunity to buy in the 4500 area if support at 4498 is retested and holds. A break below the support, on the other hand, could lead to a descent towards 4400 points.
In summary, the S&P 500 Index is on track to potentially reach new all-time highs. The current price is at 4510 points and an upward movement towards 4600 points is expected. A potential entry opportunity for a buy could be in the area of 4500 points, if the support holds. However, if the support at 4498 points is broken, the index could fall towards 4400 points.

https://de.tradingview.com/chart/QxPNsYDA/?symbol=SP%3ASPX
