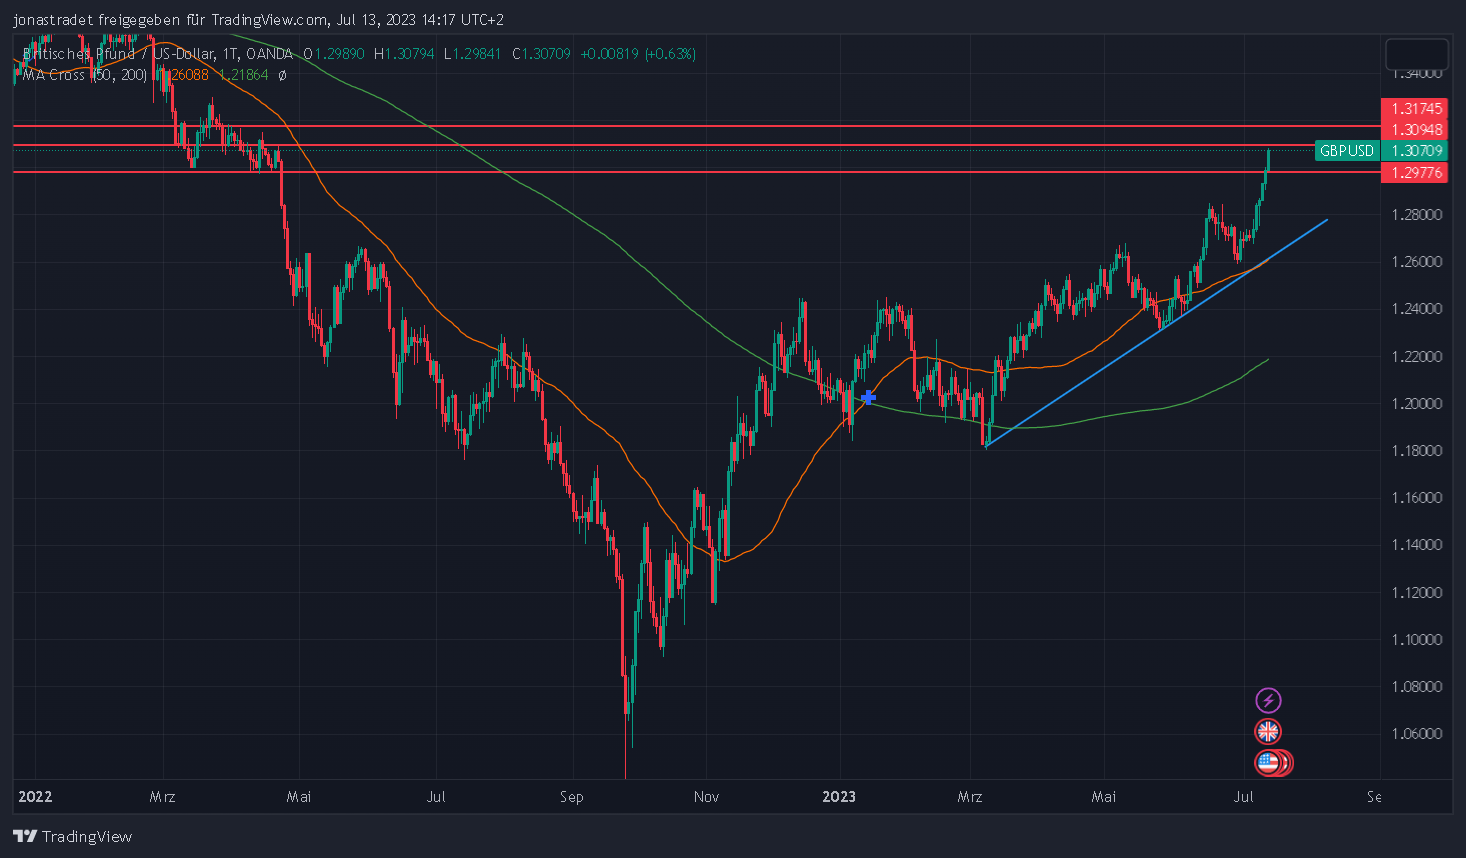
The GBP/USD has been in a strong uptrend for the past few months and today it recorded a 0.54% increase. The current price is at USD 1.3059, while the last low was around USD 1.1803 on 08 March and the price reached today’s high at around USD 1.3080.
The indicators give us further insight into the price development. The 50-day moving average is at USD 1.2609 and the 200-day moving average is at USD 1.2186. These values indicate that the upward trend has been sustained since the beginning of March.
The focus is now on the resistance and support levels. The next resistance is at USD 1.3095, while the next support is at USD 1.2978. The expected price action indicates that a possible price reversal at the resistance is to be expected, followed by a slight downward movement towards the last support.
Based on this assessment, there is a potential entry opportunity for a short trade in the USD 1.3090 area if resistance holds. Otherwise, the price could rise above the resistance at USD 1.3095 and continue to rise towards USD 1.3175, where the next resistance is located.
In addition to technical factors, current economic figures and dates should also be taken into account. At 8:00 this morning, the GDP of the UK was published, which was slightly better than expected at -0.1% and gave strength to the British pound. At 2:30 p.m., the U.S. EPI is still to be released, which could have an impact on the strength of the U.S. dollar. A slight improvement in the EPI figures is currently expected, which could strengthen the dollar in the short term.
In summary, the GBP/USD is in a strong uptrend, but a potential resistance at 1.3095 USD signals a possible reversal. An entry opportunity for a short trade could arise in the area of USD 1.3090. However, if the resistance is broken, the price could continue to rise towards USD 1.3175. The current economic figures and dates should also be kept in mind, as they can influence the price development.

