Review
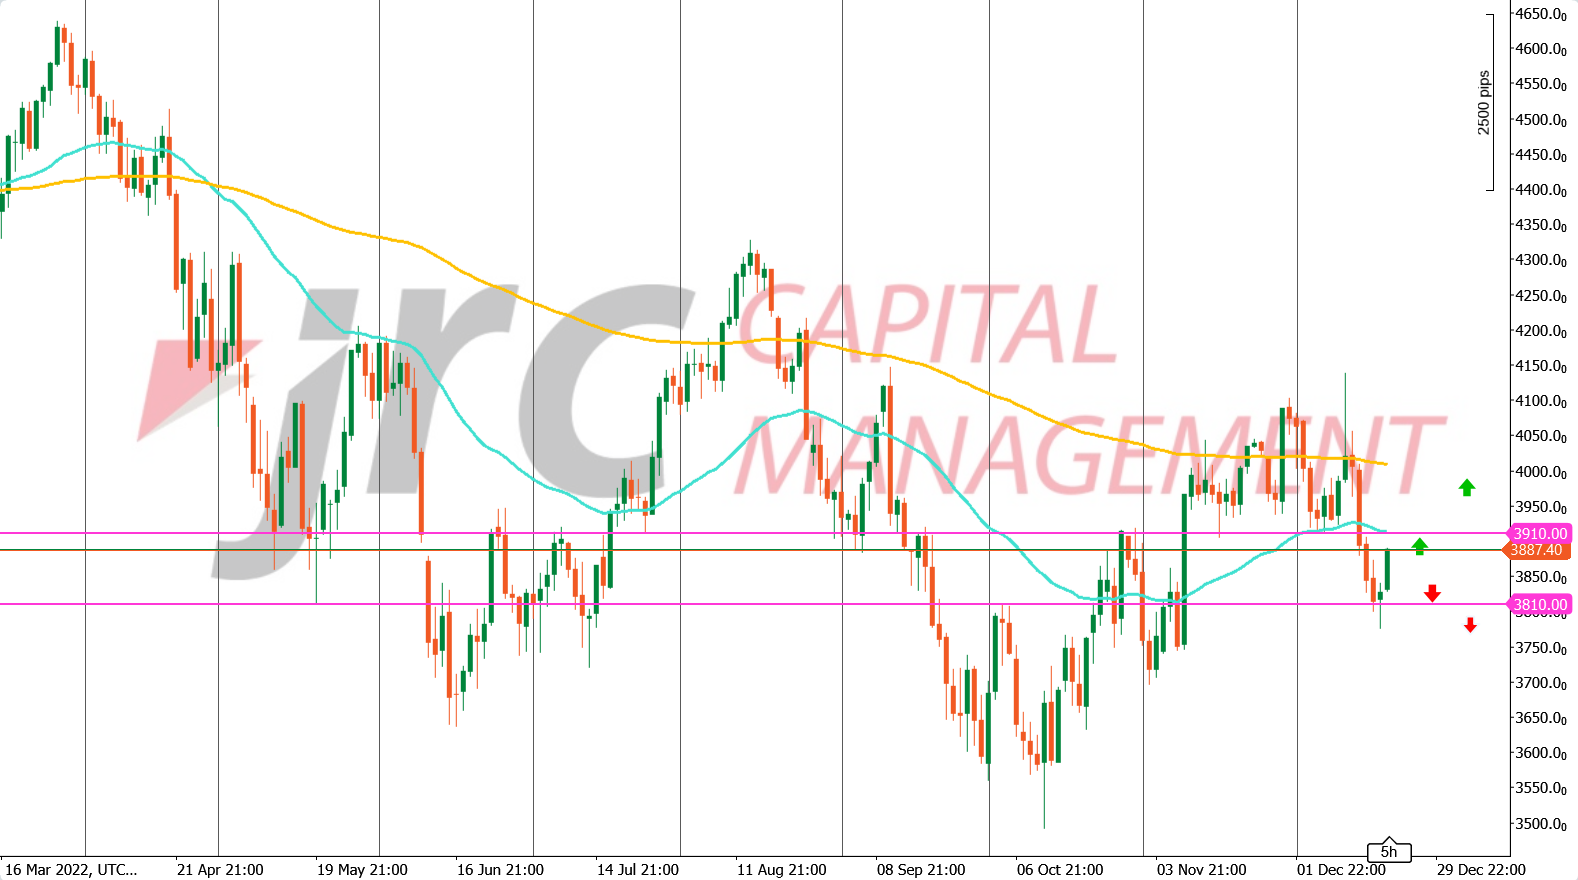
At yesterday’s market close at around 3818 points, the S&P500 index closed with a significant loss. Today, the index moved slightly up again before the stock market opened so far at 0.10%. In the long-term downtrend, the price last reached a high on Dec. 13. marked at around 4100 points. This was followed by a downward movement of almost -7.5% at times, which represents a downward breakout from a bearflag. What might happen next week?
Outlook
For the time being, the chart situation in the daily chart has not changed much over the week. In the area around 3810 points, a short-term relevant horizontal support has been established. The next important resistance is found in the area of approx. 3910 points at the last high. If the price continues to stay above the support and respects it, this can be interpreted as a bullish signal. However, if this is breached, we could see a downward movement towards 3760 points, where another support is located. Otherwise, the price could rise to the aforementioned resistance. If the price continues to rise after all, a sideways or downward movement could set in there as well for the time being.
In addition, there is still the possibility of a sideways movement in the current price level at around 3820-3830 points.

