Review
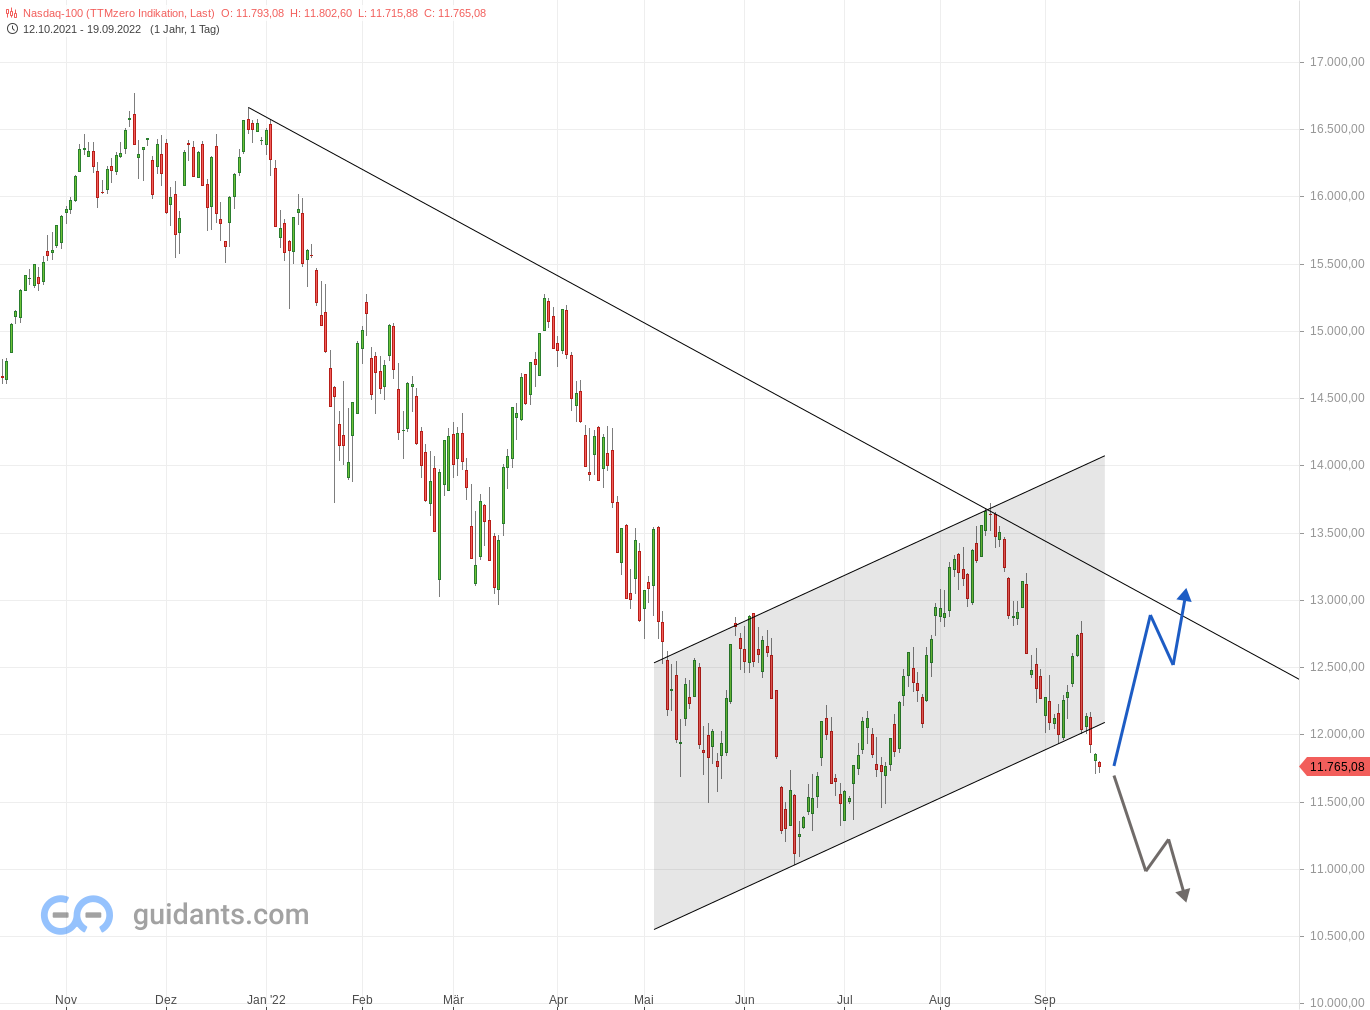
As early as June, the U.S. Nasdaq 100 index saw a correction almost to 11,000 points. This means that the index has lost almost 34% since the last all-time high, which it reached at the end of December 2021. Between June and August there was then an upward movement, which after all brought with it an increase of 24%. In mid-August, this was then interrupted by another correction and the share price fell by over 14%.
Current
At the moment, the price continues to correct. The interesting thing here is the downward breakout from a medium-term upward channel. This bearish signal could indicate further price declines. The index, which is still currently quoted at 11754 points before the market opens, could fall further in the direction of 10500 points in the coming weeks. However, to reach this level, it would have to break through the support level at 11000 points. Otherwise, I think a rise from the current price level to the next resistance at 12200 is possible. If this should not hold, the price could rise further above 12400 points.

